
As a marketer or PR manager, you’ve probably dealt with fake or negative reviews at some point. Sometimes it’s a customer fishing for a discount or a full refund — annoying, but manageable.
The real problem is competitors with fake positive reviews. Fighting shadows is exhausting — especially when Google does nothing and ignores every spam report you send.
That’s exactly why we built ReviewStatLab. We’re ex-SEO specialists and marketers who’ve been burned by this problem more than once — so we decided to build the tool we wished existed.
ReviewStatLab gives you a deeper look into Google Business Profile reviews, helps you build a case for removing fake reviews, and — if you’re not ready to fight directly — at least lets you understand exactly what you’re up against.
But before any tool can help you, you need to know what to look for. Understanding how bot farms actually operate gives you a serious edge.
How Bot Farms Work — and How to Spot Them
There are two types of fake reviewers:
- Real people who use their personal Google accounts and sell reviews on platforms like PeoplePerHour.
- Fake accounts created purely for review farming.
The first type is more expensive to buy and hard to catch. These accounts look legitimate — unique names, real profile photos, local expert status, dozens or hundreds of reviews. They’re often set to private, which makes it nearly impossible to trace which businesses are using them.
The second type — the cheap option — is much easier to spot. Because these accounts need to be created at scale and on a budget, they follow patterns. You’ll see clusters of similar names, reused profile images, characters from the same movie or franchise. Naming variations like Kirk, k1rk, k!rk are a classic tell.
One more thing worth knowing: these accounts get no maintenance — no one is actively managing them. Google will eventually detect and delete inactive accounts, taking all their reviews with them. That’s why bot farms don’t waste an account on a single review — typically each account leaves 2 to 5 reviews across different businesses, squeezing out as much value as possible while the account is still alive.
That’s the weak spot.
What Data You Need for Research
First, let’s be clear: everything here operates on probability. You’ll never know with absolute certainty that an account is fake — unless it’s yours.
That said, there’s a lot of publicly accessible data you can work with. Using ReviewStatLab or any similar Google Maps data extraction tool, you can collect:
- Creation timestamp exact date & time (not the vague “1 month ago” from the UI)
- Edit timestamp exact date & time of last edit
- Star rating 1–5 stars per review
- Review text full content of the review
- Author name display name on Google profile
- Author profile link direct URL to the reviewer’s account
- Author profile image avatar for visual pattern matching
- Company URL Google Maps business page
Not all of these signals carry equal weight — but each one can contribute to your analysis, and several will be useful as evidence when filing a Google spam report.
The weak spot
As we said — the fundamental weakness of every bot farm is maintenance. Profiles have to stay active or they get deleted, taking their reviews with them. Eventually, every business buying fake reviews runs into this wall. But until they do, those reviews are out there working against you.
So how do you make Google move faster? By detecting the network yourself.
Here’s the approach: take every account that has reviewed a target business, then look at which other businesses those same accounts have reviewed.
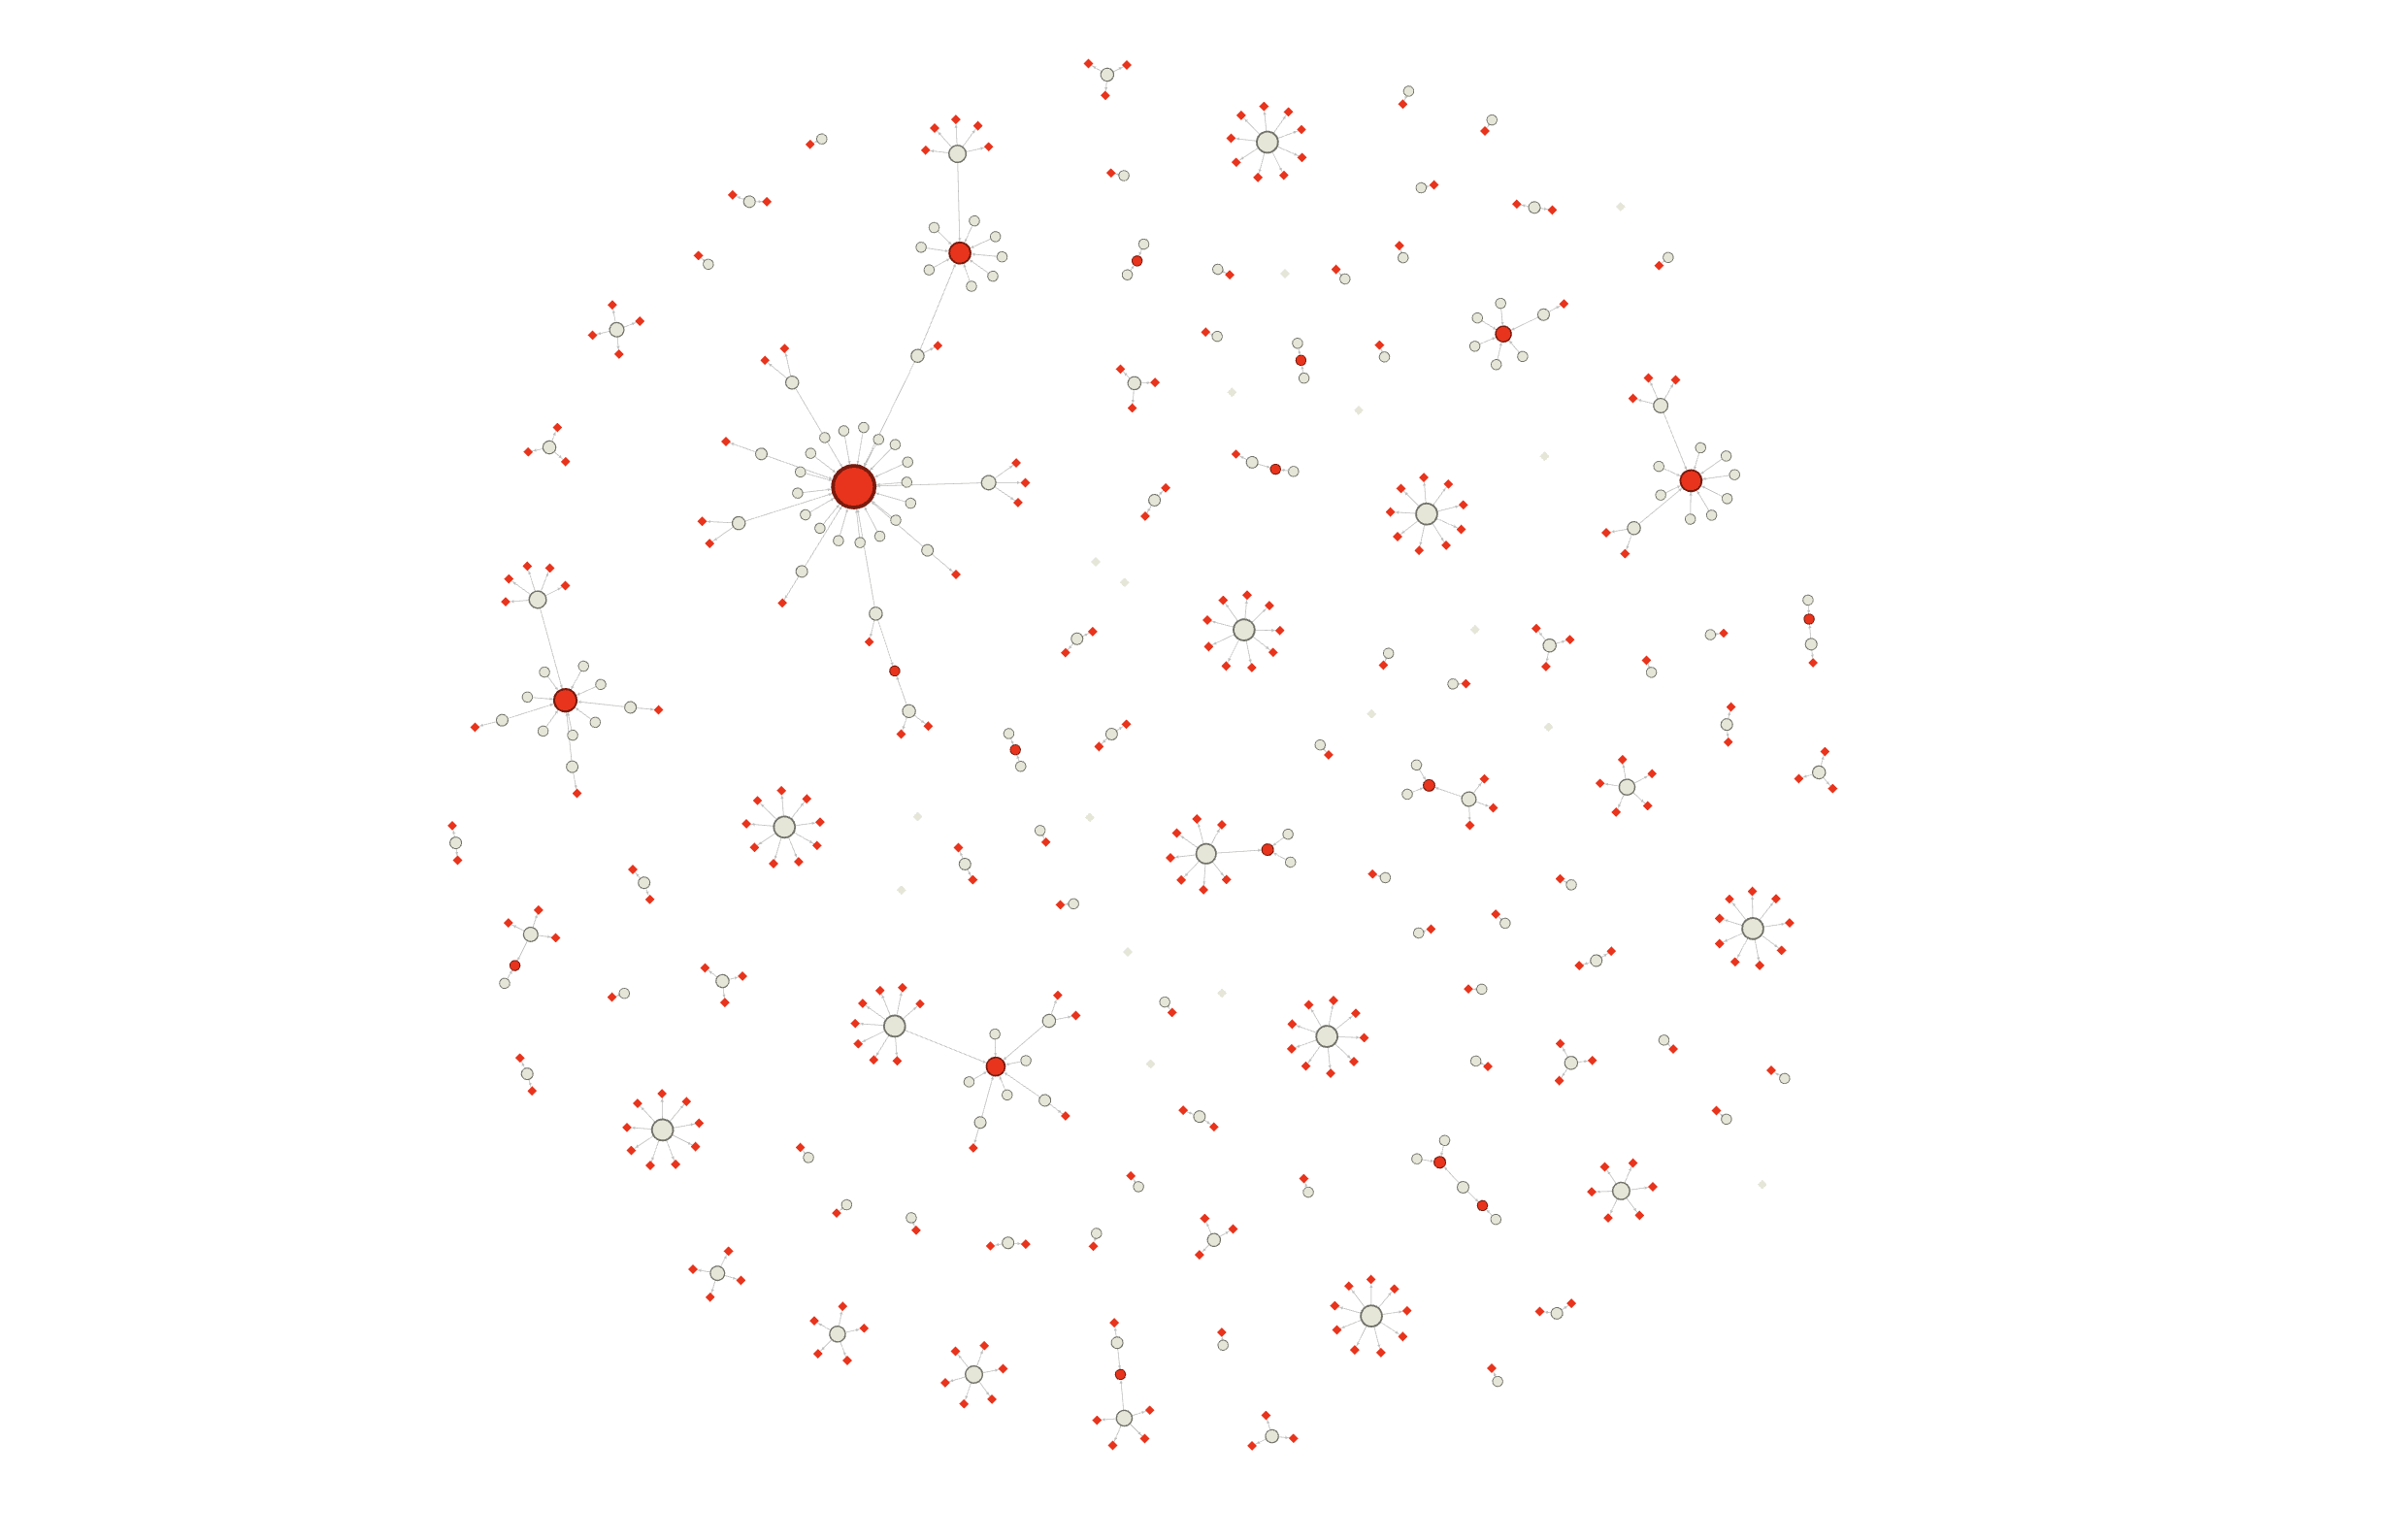
There are exceptions — very small businesses or tourist-heavy locations can look a little different. However, the key takeaway is that these networks are not strong or deeply interconnected.
This network map becomes your baseline. From here, you move to the next layer: rating patterns and timing.
Time Is the Real Signal
Ratings and timing are where fake review networks expose themselves most clearly.
Two businesses can have a completely legitimate relationship — referral partnerships, shared marketing, cross-recommendations. Hotels and car rental companies do this all the time.
But when real customers leave reviews across both businesses, the timing is unpredictable and the ratings vary widely. Natural behavior has entropy — a wide spread, no consistent pattern.
In contrast, fake reviews tend to follow consistent patterns in both rating distribution and timing. This is what we aim to detect.
When someone buys a few hundred reviews, the provider doesn’t post them all at once — they spread them out over time. The same accounts then get reused for another business, following the same posting schedule.
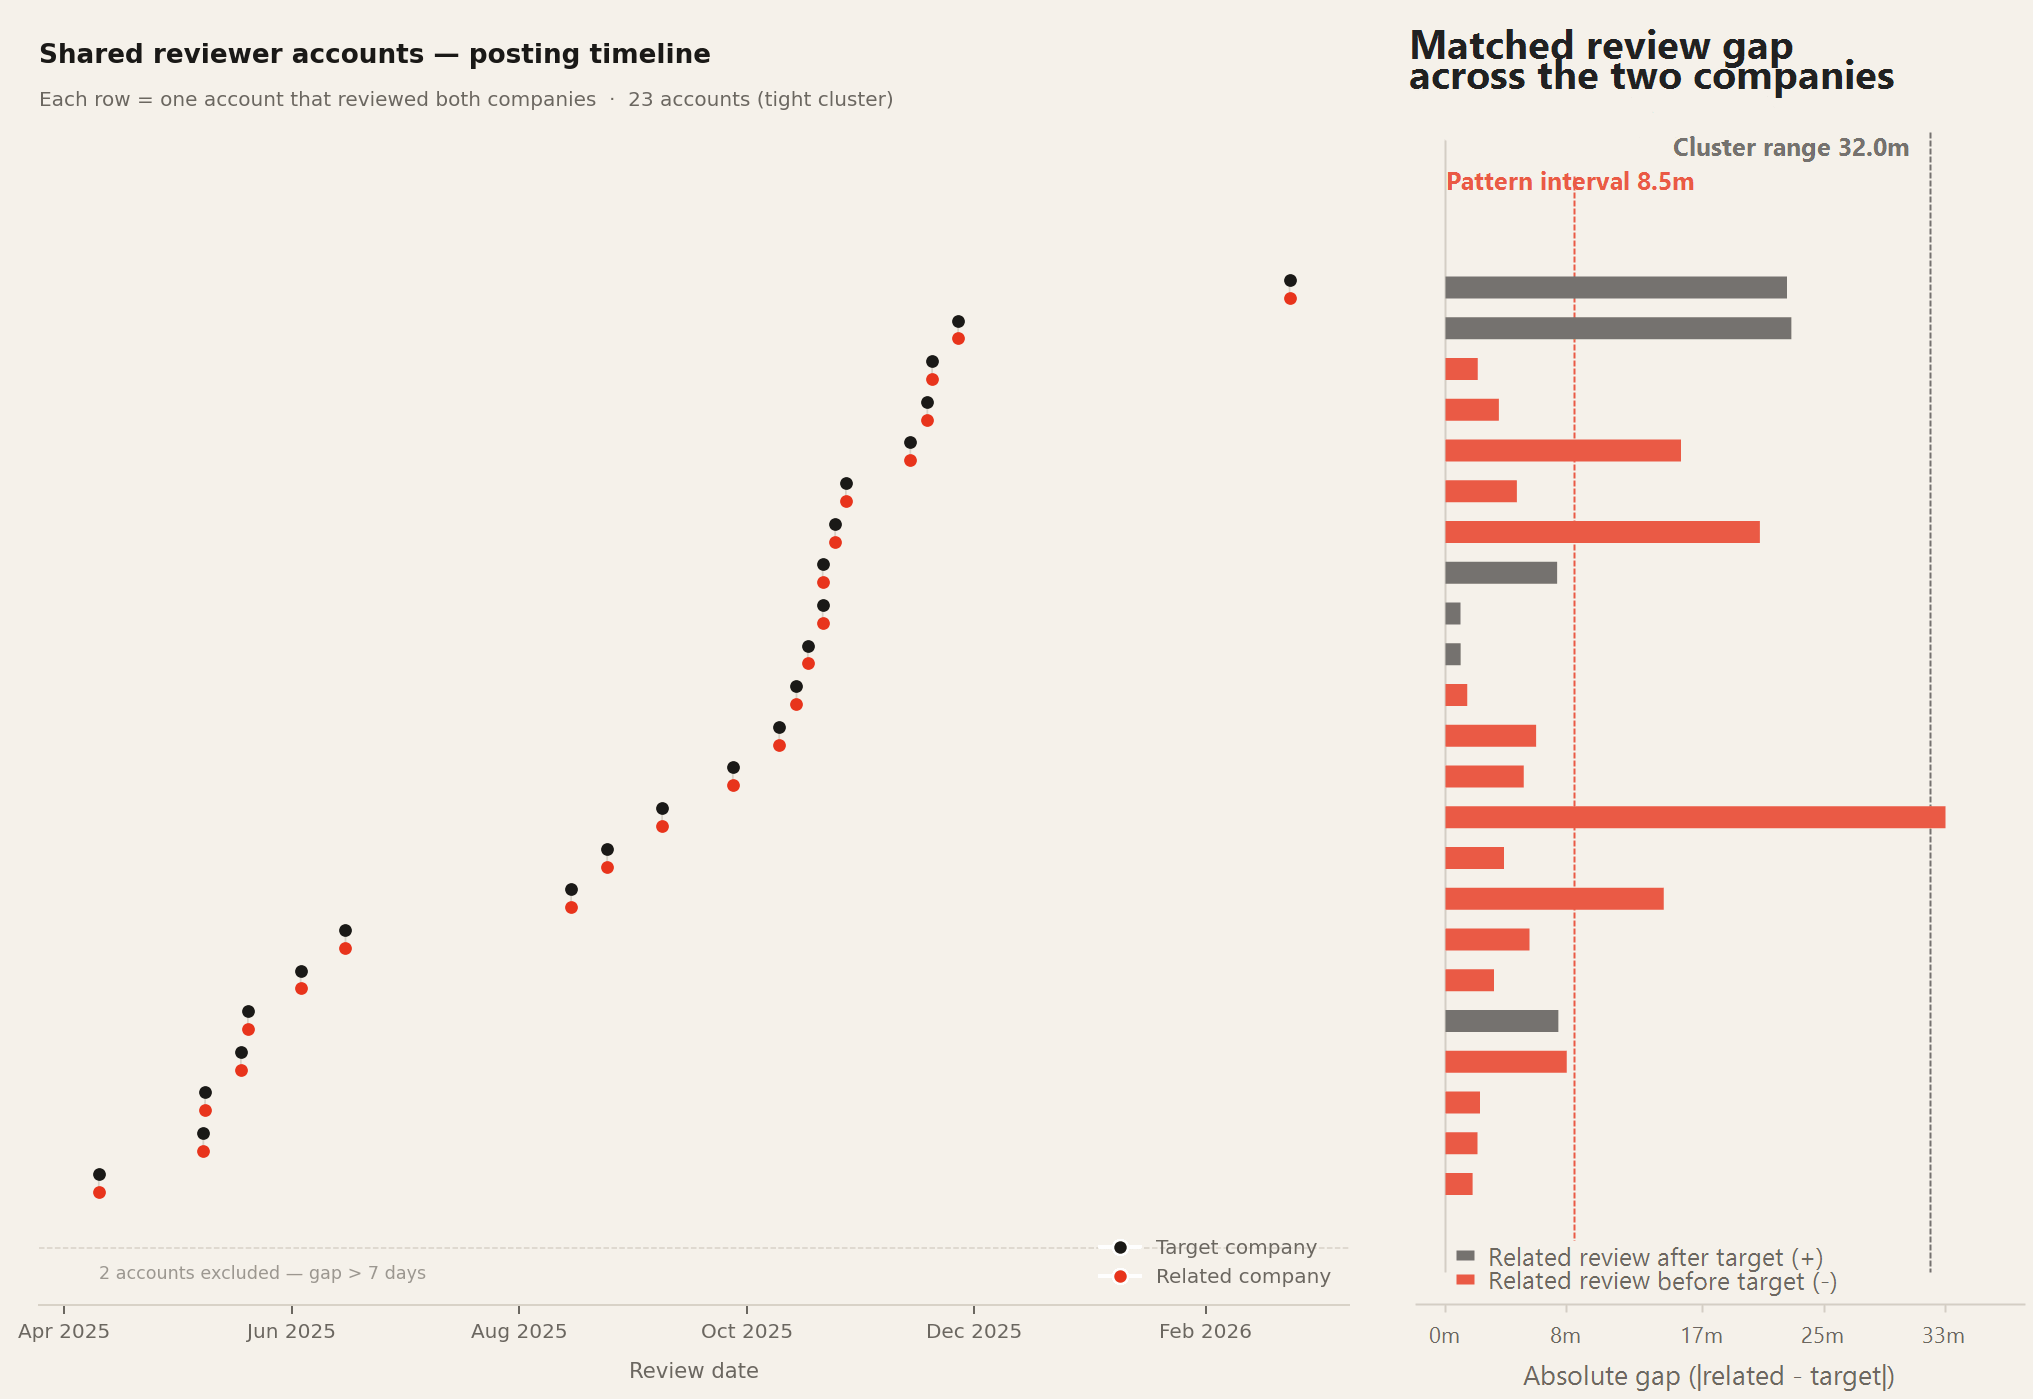
The idea of detecting fake review networks through behavioral pattern analysis isn’t new — there’s solid academic work on this if you want to dig into the statistical side of it [1]. Our own research is currently in progress — once we have enough data to publish, we will.
Seeing the Full Picture
One challenge you’ll hit is account privacy. A significant portion of Google accounts are locked down and won’t be accessible for research. That doesn’t mean every hidden account is a bot — but it does mean you need to focus your energy on the business profiles themselves, not just individual accounts.
If our tool flags suspicious activity, the next step is building a list of related businesses and manually cross-referencing authors across them. This is where hidden relationships surface — and it’s what makes your spam complaint actually stick.
This is the single most impactful type of analysis you can do with publicly available data. In some cases, it’s enough on its own to prompt Google to take a closer look, temporarily restrict a profile, remove reviews, or even take down the entire Google Business Profile.
Additional Signals Worth Checking
This kind of research takes time — especially when you’re dealing with profiles that have thousands of reviews. While the network analysis is your primary weapon, there are a few secondary signals that can help you prioritize where to dig.
Review Volume Timeline
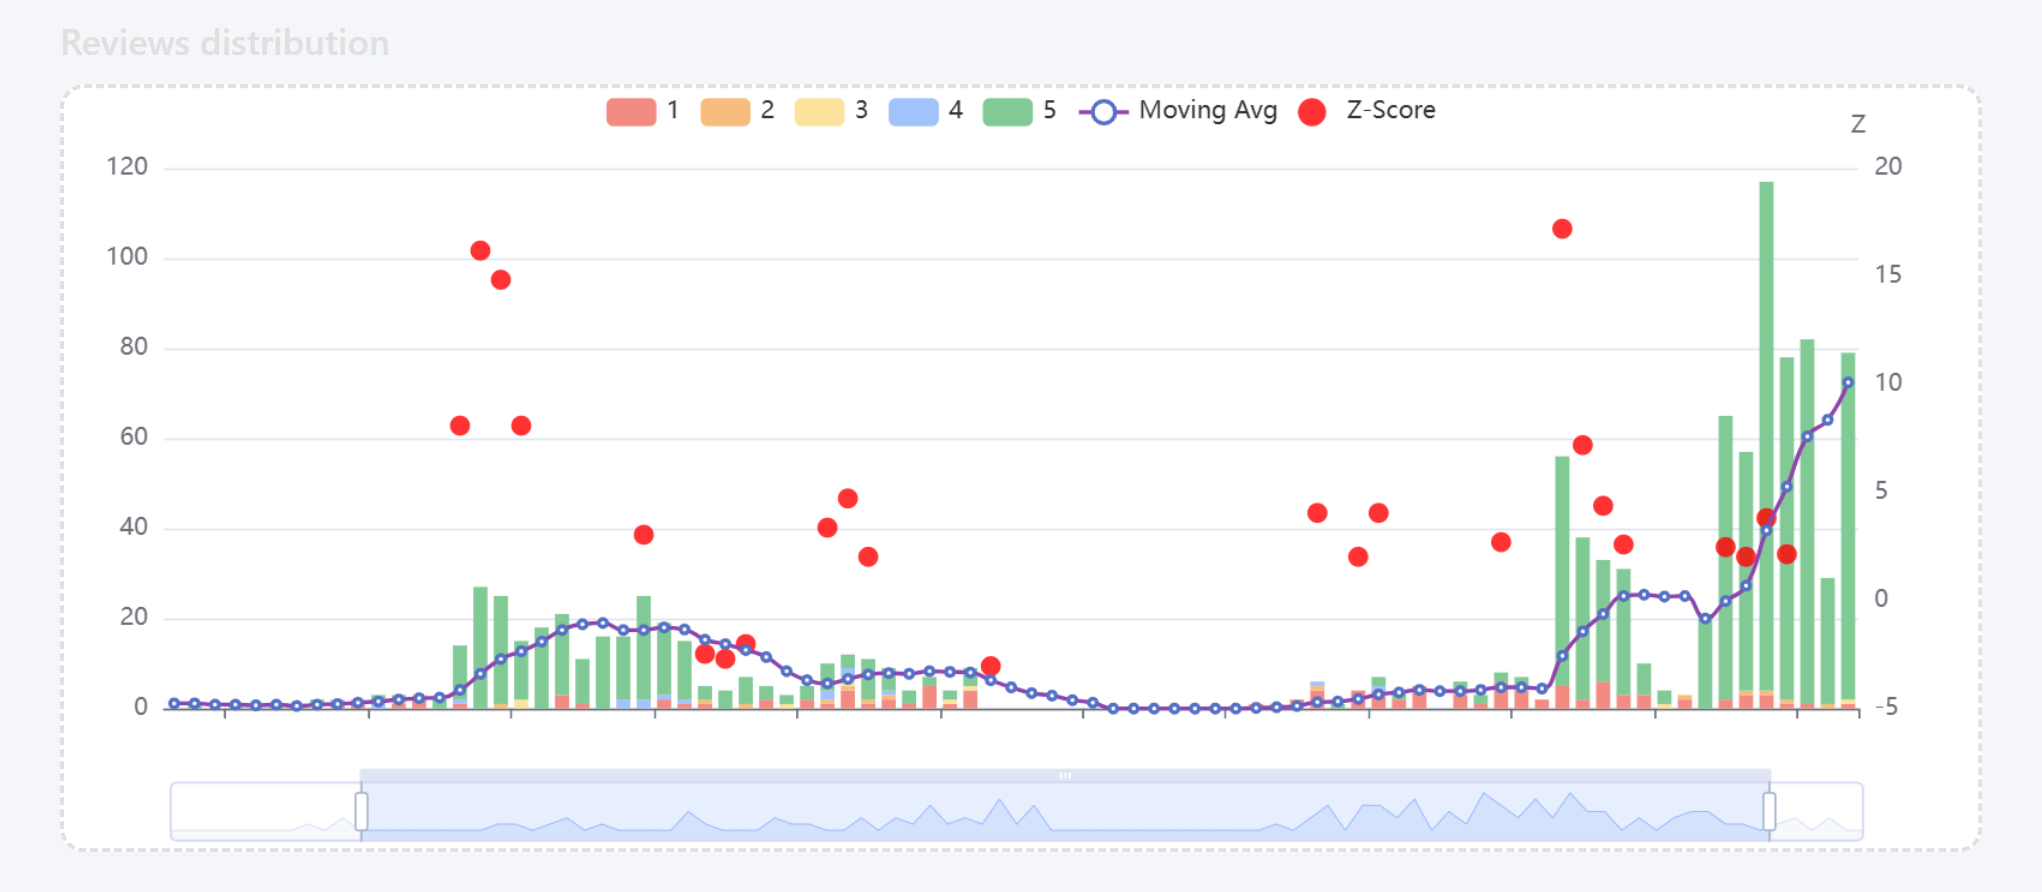
A basic timeline of when reviews were posted can reveal suspicious surges. That said, this is a weaker signal on its own — professional reputation management campaigns tend to be slow and consistent, spread over 6–12 months rather than sudden spikes. Still useful as a starting filter.
Distribution by Day of Week and Hour
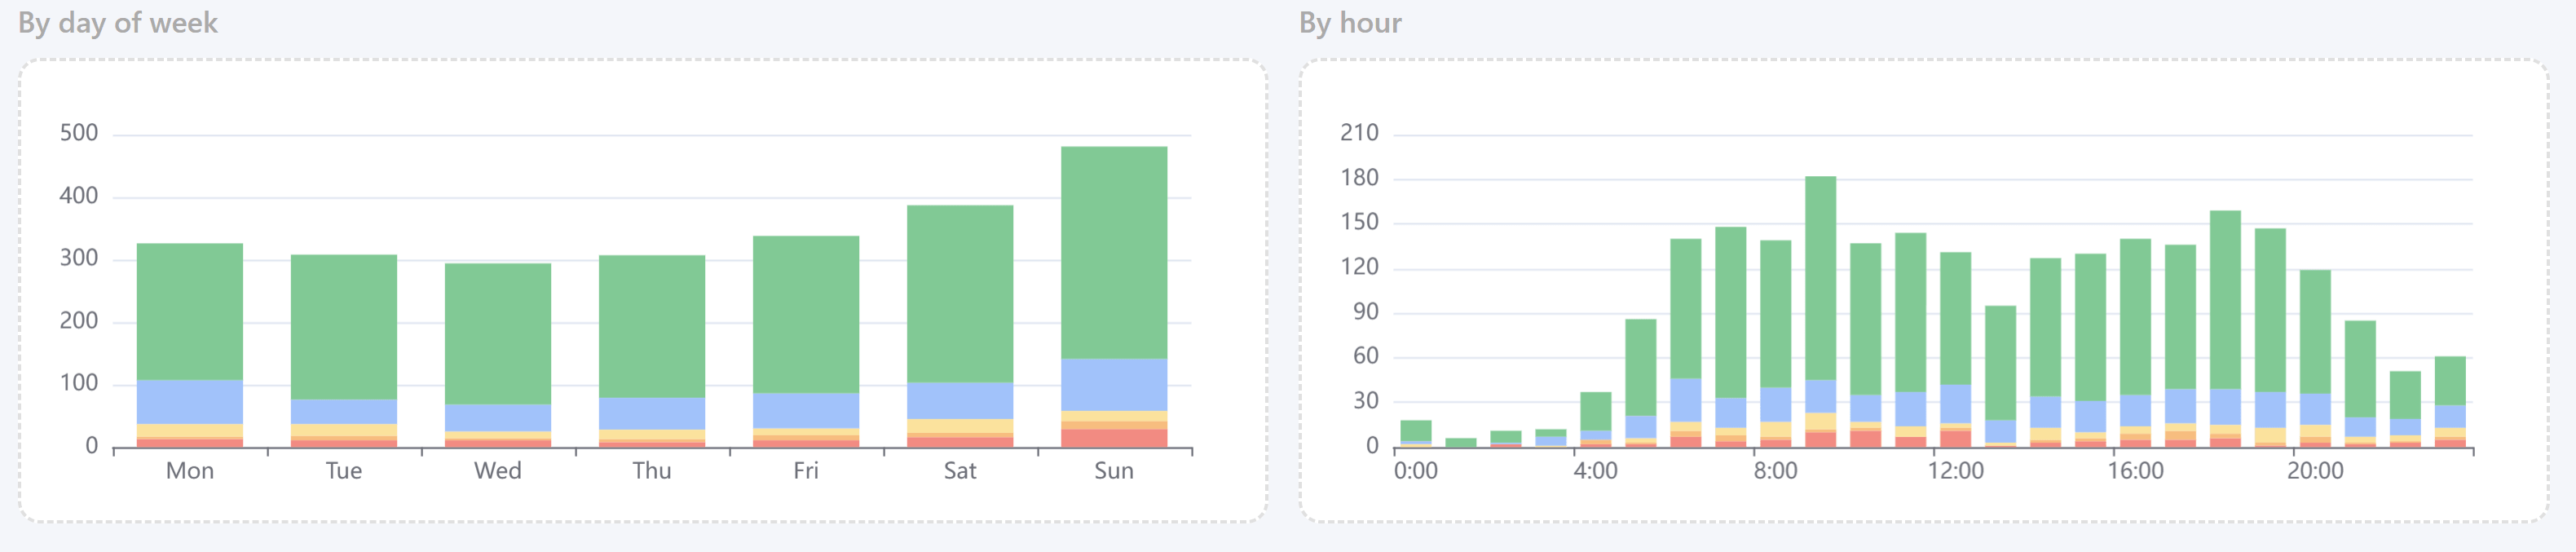
You won’t find location or IP data in Google Maps — but you can get exact timestamps. Look for reviews clustering in the 11 PM–5 AM window or heavily skewed toward Saturday and Sunday. These patterns are worth flagging for closer inspection.
Once you’ve identified a suspicious time-based cluster, look at naming patterns and profile images within that group. Neither signal is conclusive on its own — but combined with high posting velocity in a narrow time window, they become meaningful.
Isolated analysis leads to mistakes
Here’s a mistake that’s easy to make: drawing conclusions from a single business profile.
Businesses in the same location and niche tend to attract similar reviewer behavior — similar review volumes, similar timing patterns, similar account profiles. That’s just how shared markets work. Your competitor’s customers and yours overlap significantly.
This means that what looks “suspicious” for one business might actually be completely normal for the niche. You’ll only know the difference if you compare.
- Always analyze at least 5–10 competitors before drawing conclusions — what’s unusual will stand out once you have a baseline
- This comparison only works within the same geographic area — the same niche in a different city behaves differently; don’t mix regions